Solar Saves You Money Only If You Size It Correctly — Free Renewable Energy Calculators to Plan Your Transition
An oversized solar system wastes capital on panels that produce more than your roof can export. An undersized system fails to offset your bill meaningfully. Getting the numbers right before committing to a renewable installation requires five core calculations: baseline electricity consumption, energy unit conversion, solar output estimation, payback period and carbon offset. LazyTools provides all five as free, browser-based tools — with no data uploaded to any server, no account required and results in minutes.
Most People Want to Go Renewable But Don't Know Where Their Numbers Come From
The global transition to renewable energy is structurally inevitable — the levelised cost of solar and wind is now below the cost of new fossil fuel generation in most markets, and the cost gap is widening annually. Specifically, according to IRENA's Renewable Power Generation Costs 2024 report, the global average LCOE of utility-scale solar fell to $0.044/kWh in 2023, a 90% reduction since 2010, and is now below the cheapest new fossil fuel option in every major market. Furthermore, the residential economics are equally compelling: a homeowner in Dubai, London or California who installs solar panels today can expect to recover the capital cost within 8 to 12 years and then produce effectively free electricity for the remaining 13 to 17 years of panel life. Consequently, the financial case for residential solar adoption has never been stronger.
The problem is not the economics — it is the calculations. Specifically, most homeowners considering solar do not know their monthly kWh consumption, cannot convert between kWp (kilowatt-peak, the solar capacity unit) and kWh (energy produced), do not know their local peak sun hours, and cannot estimate how long before a system pays back. Furthermore, solar installers have a commercial incentive to recommend larger systems than necessary — and without the ability to independently verify the numbers, homeowners cannot challenge the recommendations. Consequently, the five LazyTools energy calculators below provide the independent calculation capability needed to model a renewable installation accurately before committing to any purchase.
Five Free Calculators That Cover the Complete Renewable Energy Decision Workflow
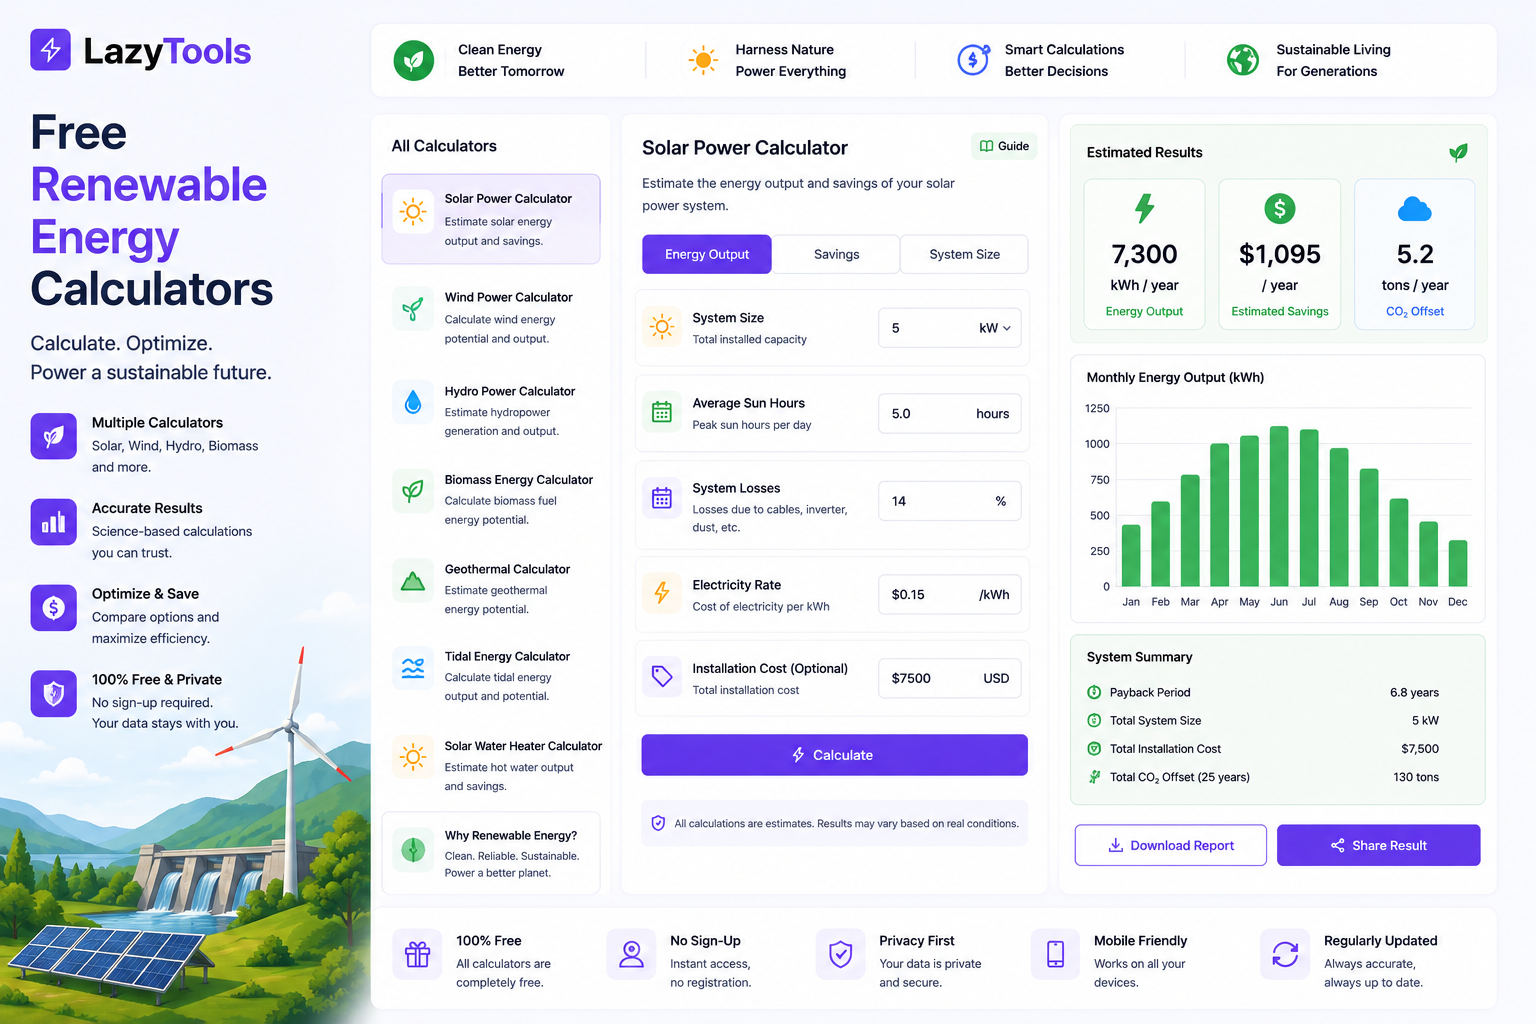
☀️ Start Your Renewable Energy Calculation
Free electricity cost, energy converter, carbon footprint and DEWA calculators. No login, no upload.
How Solar Photovoltaic Systems Work: From Sunlight to Kilowatt-Hours
A solar photovoltaic (PV) system converts sunlight into direct current (DC) electricity using the photovoltaic effect — the property of semiconductor materials (typically silicon) to release electrons when struck by photons of sufficient energy. Specifically, a solar panel consists of photovoltaic cells connected in series to produce a higher voltage and in parallel to produce a higher current. An inverter converts the DC output of the panels to alternating current (AC) compatible with household appliances and the grid. Furthermore, a net metering meter or bidirectional meter records the difference between electricity consumed from the grid and electricity exported to the grid from the solar system — the basis for net metering billing.
📊 Key Solar Metrics Explained
- Watt-peak (Wp) / Kilowatt-peak (kWp): The rated maximum power output of a solar panel or system under Standard Test Conditions (STC: 1,000 W/m² irradiance, 25°C cell temperature). Most residential panels are rated at 380 to 440 Wp. A 10-panel system at 400 Wp per panel = 4 kWp system.
- Kilowatt-hour (kWh): The actual energy produced over time. A 4 kWp system in Dubai (6.0 peak sun hours/day) produces approximately 4 × 6.0 = 24 kWh per day, or approximately 8,700 kWh per year — before losses.
- Performance ratio (PR): The ratio of actual energy produced to the theoretical maximum. Typical PR values are 0.75 to 0.85 — losses come from inverter efficiency, wiring losses, temperature derating (panels underperform above 25°C) and soiling. In the UAE, high temperatures and dust cause PR to be at the lower end of this range.
- Specific yield: kWh produced per kWp installed per year. In Dubai: approximately 1,600 to 1,900 kWh/kWp/year. In London: approximately 800 to 1,100 kWh/kWp/year.
🌡️ Temperature Derating: Why UAE Solar Underperforms Its Rating
Solar panels are rated at 25°C cell temperature, but in the UAE, roof-mounted panels frequently reach 60 to 75°C on summer days. Specifically, the temperature coefficient for most crystalline silicon panels is approximately -0.35% per degree Celsius above 25°C — meaning a panel at 65°C (40°C above the rating temperature) produces approximately 14% less than its rated wattage. Furthermore, this performance loss is partially offset by the UAE's exceptionally high irradiance — the extra sunlight compensates for the derating in the energy production calculation. Consequently, solar installers in the UAE should use temperature-corrected performance models rather than the headline kWp × PSH formula for accurate production estimates.
Step-by-Step: Sizing a Residential Solar System Using Free Calculators
Wind Power: How It Works, Where It Works Best and the Residential Reality
Wind turbines generate electricity by converting the kinetic energy of moving air into rotational motion, which drives a generator. Specifically, wind power output follows a cube law relationship with wind speed: doubling the wind speed increases power output by a factor of eight (P ∝ v³). This means that small differences in average wind speed have dramatic effects on energy production — a site with 7 m/s average wind speed produces approximately 3.4 times more energy than a site with 4 m/s average wind speed with the same turbine. Furthermore, wind turbines have a minimum cut-in speed (typically 3 to 4 m/s) below which they generate nothing, and a rated speed (typically 12 to 14 m/s) above which output is capped by the turbine's rated power.
🏡 Small Wind Turbines for Residential Use
Small wind turbines (1 to 15 kW rated power) are technically viable for residential use in rural and coastal locations with average wind speeds above 5 m/s. Specifically, they are significantly less suitable for urban environments because buildings create turbulence that reduces efficiency and increases structural fatigue. Furthermore, planning permissions for roof-mounted turbines are increasingly restrictive in many urban councils due to noise and aesthetics concerns. Consequently, small wind is most cost-effective in rural areas with exposed, unobstructed sites — where a 5 kW turbine at a site with 6 m/s average wind speed can produce 12,000 to 18,000 kWh per year, comparable to a large residential solar installation.
🏭 Utility-Scale Wind: The Economics That Are Transforming the Grid
Utility-scale onshore wind (2 to 6 MW per turbine) now has an average global LCOE of approximately $0.033/kWh according to IRENA 2024 — cheaper than any fossil fuel alternative at scale. Specifically, offshore wind (10 to 15 MW per turbine) is more expensive ($0.076/kWh average LCOE in 2024) but produces more energy per turbine due to higher and more consistent offshore wind speeds, and avoids the land use conflicts of onshore wind. Furthermore, capacity factors for offshore wind are typically 40 to 55% (the percentage of rated capacity actually produced on average), compared to 25 to 40% for onshore wind and 15 to 25% for utility-scale solar. Consequently, the right mix of solar and wind in a regional grid depends on local resource availability, land use and grid demand patterns — and most decarbonised grid scenarios use both technologies in combination rather than either alone.
Levelised Cost of Energy (LCOE): The Standard Way to Compare Power Sources
Levelised Cost of Energy (LCOE) expresses the lifetime cost of a power generation asset — including capital cost, financing, operations and maintenance, and fuel — divided by its total lifetime energy output, expressed in cost per kWh. Specifically, LCOE enables fair comparison between energy sources with very different financial profiles: a nuclear plant has enormous upfront capital cost but very low fuel cost; a gas plant has lower upfront cost but ongoing fuel cost; a solar plant has moderate upfront cost and zero fuel cost. Furthermore, LCOE does not capture all relevant factors — value of energy to the grid, backup power requirements, storage needs and grid integration costs are not captured by LCOE alone. Consequently, LCOE is the correct starting point for energy cost comparison but not the complete picture.
| Technology | Global avg LCOE 2023 | vs 2010 LCOE | Trend |
|---|---|---|---|
| Utility solar (PV) | $0.044/kWh | $0.460/kWh | -90% since 2010 |
| Onshore wind | $0.033/kWh | $0.102/kWh | -68% since 2010 |
| Offshore wind | $0.076/kWh | $0.188/kWh | -60% since 2010 |
| New gas (CCGT) | $0.059/kWh | $0.051/kWh | +16% (fuel costs) |
| New coal | $0.069/kWh | $0.111/kWh | -38% but declining |
| Large hydro | $0.026/kWh | $0.038/kWh | -32% since 2010 |
Source: IRENA Renewable Power Generation Costs 2024. LCOE in 2023 USD. These are global averages; values vary significantly by country and project.
Renewable Energy Landscape: UAE, UK, India and the United States in 2026
🇦🇪 United Arab Emirates
The UAE has among the strongest solar resources in the world — with global horizontal irradiance (GHI) of 2,200 to 2,400 kWh/m²/year, equivalent to Dubai receiving approximately 6.0 to 6.5 peak sun hours per day. Specifically, the Mohammed bin Rashid Al Maktoum Solar Park in Dubai is one of the world's largest solar projects, with planned capacity of 5 GW and electricity produced at a world-record low of $0.013/kWh (bid price for Phase 5). Furthermore, DEWA's Shams Dubai programme enables residential customers to install rooftop solar under net metering, with excess generation credited against future bills. Consequently, the UAE is simultaneously a high-energy-intensity economy (among the highest per capita consumption in the world) and a leading solar producer — making it one of the most economically attractive markets for residential solar installation globally.
🇬🇧 United Kingdom
The UK generated approximately 45% of its electricity from renewable sources in 2024, led by wind (28%) and solar (5%), with the balance from nuclear, hydro and biomass. Specifically, the UK grid's carbon intensity has fallen from approximately 500 gCO₂/kWh in 2010 to approximately 233 gCO₂/kWh in 2025 — meaning the environmental case for grid-sourced electricity in the UK is already significantly improved from a decade ago. Furthermore, UK offshore wind is one of the most cost-competitive energy sources in the world due to the UK's proximity to the North Sea with its exceptionally strong and consistent wind resources. Consequently, the UK's path to net zero in electricity is primarily a scaling problem — adding enough offshore wind and long-duration storage — rather than a technology problem.
🇮🇳 India
India has the world's fourth-largest solar installed capacity (approximately 90 GW in 2025) and ambitious targets to reach 500 GW of renewable capacity by 2030. Specifically, India's Rajasthan and Gujarat states have solar irradiance comparable to the UAE, and the Bhadla Solar Park in Rajasthan (2.25 GW) is one of the world's largest. Furthermore, India's grid emission factor remains high (0.708 kgCO₂/kWh in 2024) due to the large coal baseload — making the carbon saving from solar larger in India than in countries with cleaner grids. Consequently, residential solar installation in India has both the strongest environmental case of any major market and a growing commercial case as rooftop solar costs have fallen to approximately ₹35 to 50 per Wp installed (approximately $0.42 to 0.60/Wp).
Why Grid Carbon Intensity Determines Solar's Environmental Value
The environmental benefit of rooftop solar depends on what electricity it displaces on the local grid. Specifically, a solar panel generating 1 kWh in Australia (grid intensity 0.512 kgCO₂e/kWh) saves 512 g of CO₂e. The same panel in France (grid intensity 0.056 kgCO₂e/kWh, dominated by nuclear) saves only 56 g — 9 times less. Furthermore, the break-even point for solar's embodied carbon (the CO₂ emitted in manufacturing the panels) is typically 1 to 3 years in high-intensity grids like the UAE, Australia and India, and 3 to 7 years in low-intensity grids like France, Sweden and Norway. Consequently, solar makes the strongest environmental case in grids dominated by coal or gas, and the weakest case in already-clean grids — though the financial case depends on tariff rates rather than grid intensity.
| Country | Grid intensity (kgCO₂/kWh) | CO₂ saved per 5kWp/yr | Payback years (carbon) |
|---|---|---|---|
| India | 0.708 | ~3.5 tCO₂e | 1.2 years |
| Australia | 0.512 | ~2.6 tCO₂e | 1.6 years |
| UAE | 0.386 | ~2.0 tCO₂e | 2.1 years |
| USA (avg) | 0.386 | ~2.0 tCO₂e | 2.1 years |
| UK | 0.233 | ~1.2 tCO₂e | 3.4 years |
| France | 0.056 | ~0.28 tCO₂e | 14+ years |
Carbon payback calculated assuming 200 kgCO₂e manufacturing embodied carbon per kWp installed (typical crystalline silicon panels, 2024). Production: 5 kWp × 1,800 kWh/kWp/yr (UAE) or 1,000 kWh/kWp/yr (UK/France).
Solar Batteries: When They Make Sense and How to Calculate Storage Needs
Battery storage allows solar energy produced during the day to be used at night — increasing solar self-consumption (the percentage of generated solar energy used on-site rather than exported) and providing backup power during grid outages. Specifically, the economics of battery storage depend on three factors: the difference between the export tariff (what the grid pays for surplus solar) and the import tariff (what you pay for grid electricity at night), the battery cost per kWh of usable capacity, and the number of daily cycles over the battery's warranted life.
💰 When Battery Storage Makes Financial Sense
Battery storage is financially justified when the gap between the import and export tariff is large. Specifically, in markets where net metering provides full credit for exported solar energy (Dubai under DEWA net metering, for example), the financial case for battery storage is weak — exporting excess solar earns the same value as using it directly. However, in markets where the export tariff is lower than the import tariff (UK Smart Export Guarantee typically pays 5 to 15p/kWh export against 25 to 35p/kWh import), storing rather than exporting surplus solar adds significant value. Furthermore, backup power resilience is a non-financial benefit that many households value independently — particularly in markets with unreliable grid supply.
🧮 Calculating Battery Storage Capacity
Required battery capacity (kWh) = Nightly electricity consumption (kWh) ÷ Depth of discharge (%). For a household consuming 10 kWh between 7pm and 7am, with a battery depth of discharge of 90%: required capacity = 10 ÷ 0.90 = 11.1 kWh usable. The Tesla Powerwall 3 provides 13.5 kWh of usable capacity at a cost of approximately $8,000 to $11,000 installed. The LazyTools Electricity Cost Calculator can identify overnight consumption separately by time-of-use if you enter appliances with their specific operating hours.
Five Renewable Energy Calculation Mistakes That Lead to Wrong Decisions
❌ Mistake 1: Using STC Panel Ratings Without Performance Ratio Adjustment
Solar panels are rated under Standard Test Conditions (1,000 W/m², 25°C) that do not represent real-world operating conditions. Specifically, a 5 kWp system does not produce 5 kW at all times — it produces its rated output only at peak irradiance on a cool, clear day. Real-world production is typically 75 to 85% of the theoretical maximum (Performance Ratio of 0.75 to 0.85), meaning a 5 kWp system in Dubai actually produces approximately 5 × 6.0 PSH × 0.80 PR = 24 kWh/day rather than the 30 kWh/day that 5 kW × 6 hours would suggest. Consequently, always apply a performance ratio of 0.75 to 0.80 in UAE/hot climate calculations and 0.80 to 0.85 in temperate climate calculations.
❌ Mistake 2: Confusing kWp with kWh in Solar Quotes
A common confusion in solar quotations is between the system capacity (kWp) and the annual energy production (kWh). Specifically, a 5 kWp system is a capacity rating — how much power it can produce at one moment under ideal conditions. The 8,000 to 10,000 kWh per year it produces in Dubai is the annual energy output — the figure that actually determines the electricity bill saving and payback period. Furthermore, installers sometimes quote both figures without clearly labelling which is which, leading homeowners to compare capacity from one installer's quote with energy production from another's. Consequently, always confirm which unit a figure is in before comparing quotes: kWp for capacity, kWh for energy production.
❌ Mistake 3: Calculating Solar Savings Against Flat Tariff When Tiered Tariff Applies
In tiered tariff systems like DEWA's, the value of solar energy depends on which consumption tier it offsets. Specifically, a household consuming 5,500 kWh per month under DEWA tariffs pays AED 0.32/kWh for the units above 4,000 kWh. If the solar system reduces monthly consumption to 3,500 kWh (bringing it into the 0.28/kWh band), the first saved kWh is worth AED 0.32 but the last saved kWh (after dropping below 4,000 kWh) is worth only AED 0.28. Consequently, calculating solar savings against a blended average tariff overestimates the true saving — use the DEWA Bill Calculator to model the before and after bills accurately.
❌ Mistake 4: Assuming the Grid Will Always Buy Surplus Solar at the Same Price
Net metering policies — which credit surplus solar exports at full retail tariff — are not permanent in any market. Specifically, several markets including California, Nevada, Australia and parts of Europe have already reduced solar export tariffs as solar penetration has grown, on the grounds that daytime oversupply reduces the wholesale value of additional solar generation. Furthermore, the UAE's DEWA net metering scheme may evolve as solar penetration on the distribution network increases. Consequently, do not assume that net metering credit rates will remain unchanged for the full 25-year life of a solar installation — model the payback at the current rate and consider sensitivity to a 30 to 50% reduction in export value.
❌ Mistake 5: Ignoring Soiling Losses in Desert Environments
In the UAE, Saudi Arabia, India and other dusty or sandy environments, solar panels accumulate dust and sand on their surface that reduces energy output. Specifically, studies by the UAE's Masdar Institute have measured soiling losses of 1 to 6% per week in the UAE without cleaning — potentially 25 to 30% total loss in output if panels are not cleaned regularly. Furthermore, the cleaning frequency required to maintain efficient production in the UAE (approximately every 2 to 4 weeks, depending on location) adds a maintenance cost that most simple payback calculations omit. Consequently, factor in soiling losses and cleaning costs when calculating UAE solar system economics.
How AI Is Accelerating the Renewable Energy Transition
Artificial intelligence is transforming renewable energy across four domains: grid management, solar and wind forecasting, energy system design and demand response optimisation.
⚡ AI for Grid Balancing and Demand Forecasting
As solar and wind penetration increases, grid operators face greater challenges balancing supply (which depends on weather) with demand (which follows predictable but variable patterns). Specifically, AI forecasting systems used by grid operators including National Grid ESO (UK), CAISO (California) and DEWA (Dubai) use machine learning models trained on weather data, historical demand patterns and real-time sensor feeds to predict renewable generation and demand with sufficient accuracy to minimise the backup fossil fuel capacity required. Furthermore, DeepMind's AI for UK National Grid demonstrated a 10% reduction in carbon emissions from grid balancing decisions by optimising when to use different generators — reducing the curtailment of renewable energy and the dispatch of fossil backup. Consequently, AI is a force multiplier for renewable penetration — enabling grids to absorb more variable renewable energy than would otherwise be technically manageable.
☀️ AI for Solar Panel Performance Monitoring
AI-powered solar monitoring platforms including Enphase Energy, SolarEdge and Tigo use machine learning to detect underperforming panels, predict failures before they cause production losses, and diagnose fault causes (soiling, shading, delamination, cell degradation) from energy production pattern analysis. Specifically, these systems can identify a single underperforming panel in a 30-panel array within 24 hours of the fault developing — compared to the weeks or months it might take to notice the 3% total production drop that one panel represents. Furthermore, AI soiling detection can recommend optimal cleaning timing based on production pattern analysis — extending panel life and maximising energy yield without over-servicing.
💡 AI for Energy System Design
AI-powered energy system design tools including Aurora Solar, Helioscope and SAM (NREL's System Advisor Model) use machine learning to optimise solar panel placement, string configuration, inverter sizing and battery capacity for any given roof, location and consumption profile. Specifically, these tools model shading from trees, chimneys and neighbouring buildings at sub-hourly resolution throughout the year — producing significantly more accurate production estimates than rule-of-thumb sizing. Furthermore, AI optimisation can reduce system cost by 5 to 15% by identifying the optimal trade-off between panel count, string configuration and inverter capacity for a given budget and roof constraint. Consequently, the calculation workflow described earlier in this guide is increasingly automated by AI design tools — though understanding the underlying numbers remains essential for evaluating the outputs these tools produce.
Renewable Energy Questions Answered Directly
How many solar panels do I need for a typical Dubai apartment?
A typical 2-bedroom Dubai apartment consumes 500 to 900 kWh per month. At Dubai's average of 6.0 peak sun hours per day and a performance ratio of 0.80, a 4 kWp system (10 panels at 400 Wp each) produces approximately 4 × 6.0 × 30 × 0.80 = 576 kWh per month — covering a typical apartment's consumption in average months. However, in summer (June to August), consumption rises significantly due to air conditioning — a 4 kWp system in July produces approximately 700 to 750 kWh but consumption may reach 1,200 to 1,500 kWh, requiring grid top-up or a larger system. Use the Electricity Cost Calculator to determine your specific consumption before sizing any system.
What is the difference between kW and kWh for solar panels?
kW (kilowatt) measures power — the instantaneous rate of energy flow. kWh (kilowatt-hour) measures energy — the total amount of electricity consumed or produced over time. A 5 kW solar system running at full output for 1 hour produces 5 kWh of energy. Over a full day with 6 peak sun hours and a performance ratio of 0.80, it produces 5 × 6 × 0.80 = 24 kWh. Your electricity bill is in kWh (energy consumed); your solar system capacity is in kWp (peak power). Use the LazyTools Energy and Power Converter to switch between these and other energy units.
How long does a solar panel last in the UAE?
Modern crystalline silicon solar panels are typically warranted for 25 years of performance, with a guaranteed output of at least 80% of original rated power at year 25. Real-world degradation rates are approximately 0.5% per year for good-quality panels — meaning a panel producing 400 Wp new will produce approximately 350 Wp (87.5% of original) at year 25. In UAE conditions, UV exposure, high temperatures and thermal cycling accelerate degradation slightly compared to temperate climates — good-quality panels from Tier 1 manufacturers (Jinko, LONGi, Canadian Solar, JA Solar) typically degrade at 0.5 to 0.7% per year under UAE conditions. Consequently, using 25-year system life and 0.6% annual degradation in UAE payback calculations is appropriate.
Authoritative Sources on Renewable Energy and Solar Economics
📊 Cost and Market Data
- IRENA Renewable Power Generation Costs 2024 — The authoritative annual report on solar, wind and other renewable LCOE trends globally
- IEA Renewables 2025 Report — Global renewable energy capacity, growth projections and market analysis for solar and wind
- NREL System Advisor Model (SAM) — Free, research-grade solar and wind energy system design and financial analysis tool from the US National Renewable Energy Laboratory
☀️ Solar Resources and Assessment Tools
- EU JRC PVGIS Tool — Free EU Joint Research Centre tool for estimating solar PV energy output at any location worldwide based on satellite irradiance data
- World Bank Global Solar Atlas — Interactive map of global horizontal irradiance and photovoltaic power potential for any location on earth
- DEWA Shams Dubai Solar Programme — Official DEWA net metering scheme for residential solar customers in Dubai
💻 Standards and Research
- NREL Solar Research — US National Renewable Energy Laboratory solar research including cell efficiency records and system performance databases
- IPCC AR6 Working Group III Chapter 6 — Energy Systems — The scientific basis for renewable energy's role in limiting warming to 1.5°C and 2°C
- Masdar — Abu Dhabi Future Energy Company — UAE-specific renewable energy research including soiling studies, desert solar performance and UAE grid integration
Frequently Asked Questions About Renewable Energy
Solar Sizing and Economics
Solar Savings and Carbon
The Future of Renewable Energy: Next-Generation Solar, Green Hydrogen and the 1.5°C Pathway
The renewable energy transition is accelerating beyond most projections — driven by cost curves, policy momentum and the commercial logic of energy security. Three technologies and trends will define the next phase.
🔋 Next-Generation Solar: Perovskite and Tandem Cells
Standard crystalline silicon solar cells are approaching their theoretical efficiency limit (approximately 29% for single-junction silicon). Specifically, perovskite solar cells — a class of semiconductor materials with a distinctive crystal structure first demonstrated for solar use in 2012 — have achieved laboratory efficiencies of over 26% as single-junction cells and over 33% as tandem cells paired with silicon. Furthermore, tandem perovskite-silicon cells have been demonstrated at efficiencies above 33% in laboratory conditions by Fraunhofer ISE and NREL — significantly above the silicon single-junction limit. Additionally, perovskite manufacturing costs are potentially much lower than silicon due to lower processing temperatures. Consequently, if perovskite durability challenges (sensitivity to moisture and heat) are resolved at commercial scale — which is the current focus of intensive research — the next generation of solar panels could produce significantly more electricity per panel at lower cost.
💧 Green Hydrogen: Renewable Energy Storage at Scale
Green hydrogen is produced by using renewable electricity to split water into hydrogen and oxygen through electrolysis. Specifically, it addresses one of the fundamental challenges of deep decarbonisation: long-duration energy storage and the decarbonisation of industrial processes (steel, cement, fertiliser production) that cannot be electrified directly. Furthermore, the UAE has ambitious green hydrogen ambitions — the UAE Hydrogen Leadership Roadmap targets being one of the world's top 10 hydrogen exporters by 2030, leveraging the country's solar resources and existing gas infrastructure for hydrogen transport and storage. Additionally, ADNOC and Masdar have committed to multiple gigawatt-scale green hydrogen projects. Consequently, green hydrogen is creating a new demand signal for renewable electricity at scale — and a potential export pathway for solar and wind-rich countries that can produce more renewable energy than their domestic grids can absorb.
🌍 The 1.5°C Pathway: What It Requires from Renewables
The IPCC Sixth Assessment Report concludes that limiting warming to 1.5°C requires reducing global CO₂ emissions by approximately 45% by 2030 relative to 2010 levels and reaching net zero by around 2050. Specifically, the energy sector must provide approximately 70 to 85% of global electricity from renewable sources by 2050 under most 1.5°C scenarios — compared to approximately 30% in 2024. Furthermore, IEA's Net Zero by 2050 pathway requires adding approximately 630 GW of new solar and wind capacity per year globally through to 2030 — more than double the record additions of 2023. Consequently, the pace of renewable deployment required for a 1.5°C pathway is extraordinary — and will require every level of action from individual rooftop solar installation to utility-scale project development to regulatory reform, all simultaneously.