You Cannot Reduce What You Have Not Measured — Five Free Sustainability Calculators for Individuals and Small Businesses
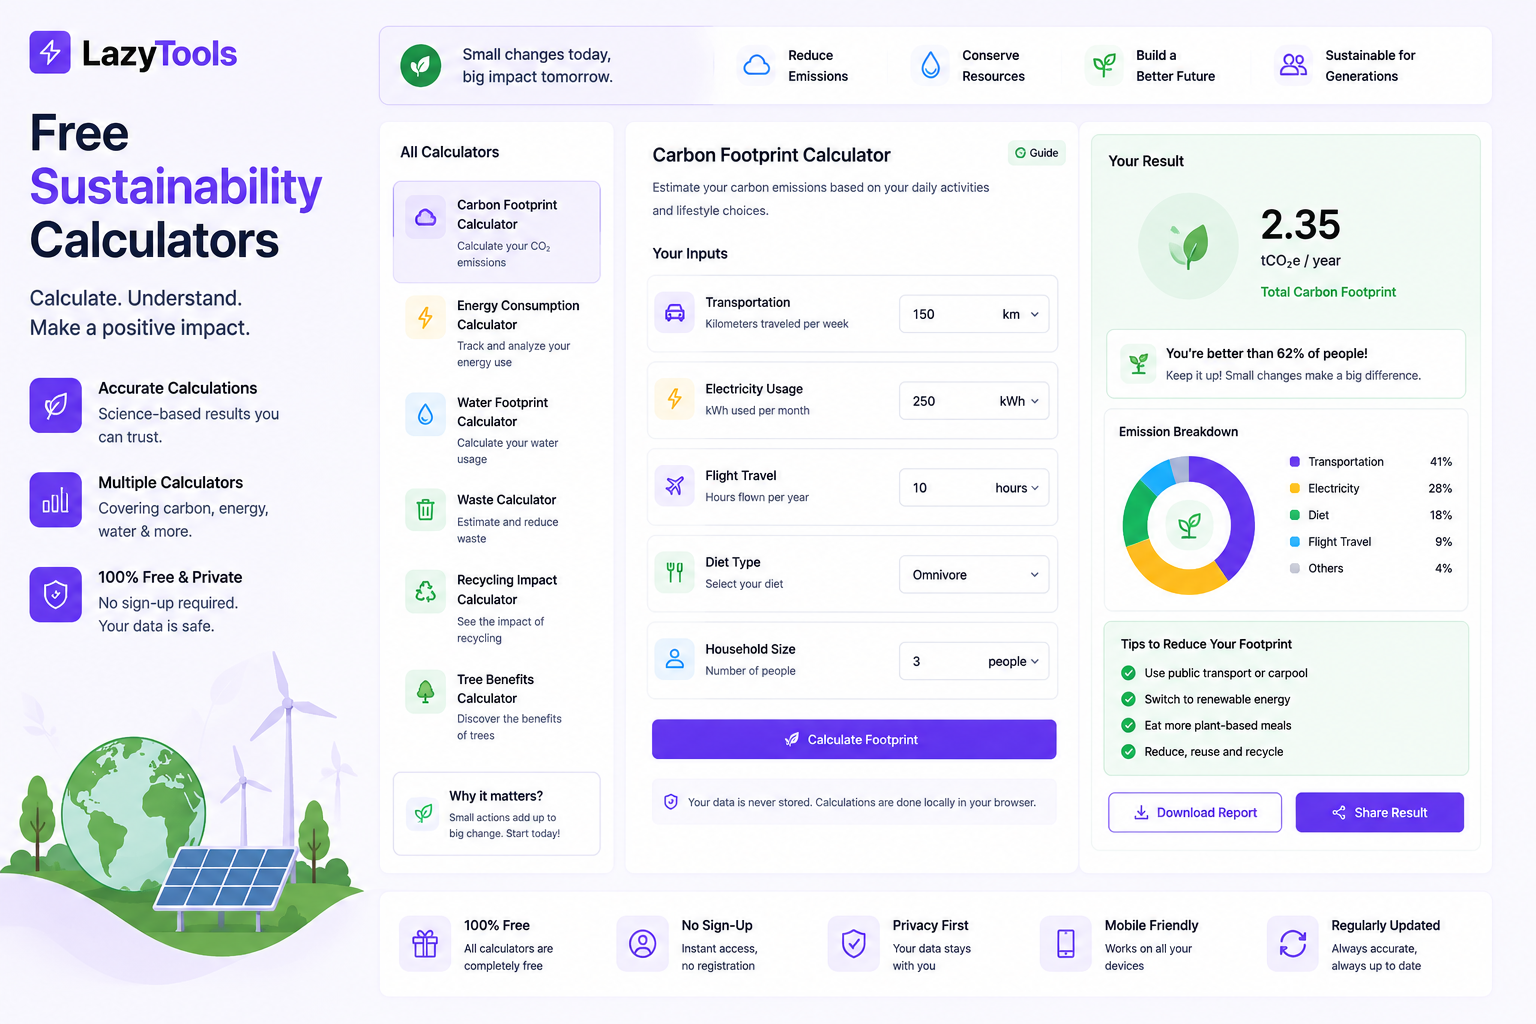
Most people underestimate their carbon footprint by 40% because they only count flights and never measure home energy, transport habits or consumption patterns. LazyTools provides five free, browser-based sustainability calculators — covering carbon footprint, electricity cost, fuel emissions, utility bills and energy unit conversion — that give you a complete, measurable picture of your environmental impact in minutes, with no account and no data leaving your device.
You Cannot Reduce What You Have Not Measured: The Sustainability Data Gap
The single most common barrier to meaningful personal or business sustainability action is the absence of baseline data. Specifically, research published in the journal Nature Climate Change found that individuals who actively measured their carbon footprint reduced their emissions by an average of 19% within six months — simply because measurement made the largest contributors visible and actionable. Furthermore, most people underestimate their annual carbon footprint by 40 to 60%, according to a 2023 study from the University of Leeds, because they focus on dramatic single events like international flights while systematically ignoring the cumulative impact of daily energy consumption, home heating and routine transport.
The business case for measurement is equally compelling. Specifically, the Science Based Targets initiative (SBTi) now requires organisations committing to net-zero pathways to calculate their Scope 1, 2 and 3 emissions annually — and regulators in the EU, UK and increasingly the UAE are expanding mandatory climate disclosure requirements to cover mid-market businesses, not just listed corporations. Furthermore, supply chain carbon accounting is becoming a commercial necessity: major buyers including Apple, Unilever and the UAE government's procurement frameworks are beginning to require carbon data from suppliers. Consequently, measurement is no longer an optional sustainability gesture — it is an emerging commercial and regulatory requirement that affects businesses of every size.
Five Free Sustainability Calculators: What Each Does and When to Use It
🌱 Start Measuring Your Impact Now
Five free sustainability calculators — no login, no data upload, results in minutes.
Free Carbon Footprint Calculator: Measure Your Annual CO2 Emissions Across All Categories
The LazyTools Carbon Footprint Calculator calculates your total annual CO2 equivalent (CO2e) emissions across four major categories: home energy (electricity and gas), transport (car, flights, public transit), diet (meat-heavy through vegan) and consumption (shopping, waste, goods). Specifically, it uses the UK Government BEIS 2026 emission factors as the baseline calculation engine — the same factors used by professional sustainability consultants and corporate carbon accounting tools.
📊 What the Carbon Footprint Calculator Measures
- Home energy: Electricity consumption converted to CO2e using the grid emission factor for your country (0.233 kgCO2e/kWh for UK grid 2025, 0.386 kgCO2e/kWh for UAE, 0.386 for US average). Gas consumption at 0.182 kgCO2e/kWh.
- Transport: Personal vehicle miles or kilometres with emission factor by fuel type (petrol: 0.170 kgCO2e/km, diesel: 0.158 kgCO2e/km, electric: grid-dependent). Short and long-haul flights with radiative forcing multiplier of 1.9x applied to actual fuel emissions.
- Diet: Meat-heavy diet generates approximately 3.3 tCO2e/year from food alone. Vegan diet generates approximately 1.5 tCO2e/year. The calculator covers five diet categories with weighted emission factors.
- Consumption: New clothing, electronics, home goods and services, quantified using spend-based emission factors.
🌳 Understanding Your Result: Trees, Tonnes and Targets
The calculator expresses your footprint in tonnes of CO2 equivalent per year and translates it into two meaningful comparisons: the number of mature trees required to absorb the equivalent CO2 annually (one mature tree absorbs approximately 21 kg of CO2 per year, meaning the global average footprint of 4 tCO2e requires approximately 190 trees to offset), and the percentage above or below the 1.5°C-compatible target of 2.3 tCO2e per person per year set by the IPCC.
Free Electricity Cost Calculator: Know Exactly What Each Appliance Costs Per Month
The Electricity Cost Calculator converts appliance power ratings and usage hours into precise monthly and annual electricity costs. Specifically, it accepts multiple appliances simultaneously — enter your air conditioner, refrigerator, washing machine, water heater and lighting in one session, and see both the individual and total costs at once. Furthermore, it accepts any electricity tariff in any currency, making it useful for households globally, not just in countries with standardised tariff structures.
🧮 The Formula Behind the Calculator
Energy cost = Power (kW) × Hours per day × Days per month × Tariff (per kWh). For example, a 2.0 kW air conditioner running 10 hours per day for 30 days at a tariff of AED 0.28/kWh costs 2.0 × 10 × 30 × 0.28 = AED 168 per month. Furthermore, the calculator also shows the monthly CO2 emissions from each appliance using the local grid emission factor, so you can see which appliances are both the most expensive and the highest emitters simultaneously — they are often the same ones, but not always.
💡 High-Impact Appliances to Target First
Air conditioning and heating account for 40 to 60% of residential electricity bills in warm climates. Specifically, replacing a 15-year-old 3.5 kW window air conditioner (EER 2.5) with a modern inverter unit (EER 4.5) at the same usage pattern reduces electricity consumption from 1.4 kW to 0.78 kW — a 44% reduction on that appliance alone. Furthermore, water heaters and electric ovens are systematically underestimated contributors because they are used in short bursts that feel minor but accumulate significantly. Consequently, use the calculator to input your specific appliances at their actual power ratings, not generic estimates.
Free Fuel Cost Calculator: Trip Cost and CO2 Emissions for Any Vehicle
The Fuel Cost Calculator calculates both the financial cost and the CO2 emissions of any road journey. Specifically, it accepts distance in kilometres or miles, fuel efficiency in L/100km, km/L, mpg (UK) or mpg (US), and the current fuel price per litre or gallon — producing both the trip cost and the CO2 emissions in kilograms for the journey. Furthermore, it covers petrol, diesel, LPG and electric vehicles, with EV calculations using the local grid emission factor per kWh consumed.
🚗 Comparing Fuel Types on Emissions
| Fuel Type | CO2e per litre | Avg efficiency | CO2e per 100 km |
|---|---|---|---|
| Petrol | 2.31 kg/L | 12 km/L | 19.3 kg |
| Diesel | 2.68 kg/L | 16 km/L | 16.7 kg |
| LPG | 1.64 kg/L | 10 km/L | 16.4 kg |
| Electric (UAE grid) | 0.386 kg/kWh | 6.5 km/kWh | 5.9 kg |
| Electric (UK grid 2025) | 0.233 kg/kWh | 6.5 km/kWh | 3.6 kg |
Source: UK Government BEIS 2025 Greenhouse Gas Conversion Factors. Efficiency figures are typical averages; actual values vary by vehicle model and driving conditions.
Free DEWA Bill Calculator: Dubai Electricity and Water Costs with Tiered Tariff Applied
The DEWA Bill Calculator calculates Dubai residential electricity and water bills by applying the Dubai Electricity and Water Authority tiered tariff structure automatically. Specifically, instead of requiring residents to manually apply multiple rate bands, the calculator accepts total monthly consumption and returns the exact bill with each consumption tier broken out — showing exactly how much of the bill falls into each pricing band.
💰 DEWA Residential Electricity Tariff 2026
DEWA's tiered pricing is designed to incentivise conservation by charging higher rates as consumption increases. Specifically, the first 2,000 kWh per month is charged at AED 0.23/kWh. Consumption from 2,001 to 4,000 kWh is charged at AED 0.28/kWh. From 4,001 to 6,000 kWh, the rate rises to AED 0.32/kWh. Above 6,000 kWh, the rate is AED 0.38/kWh. Furthermore, a fuel surcharge and a fixed infrastructure charge apply on top of the consumption charge. Consequently, a household consuming 5,500 kWh per month pays across four different rates rather than a single flat rate — a calculation that is error-prone when done manually but straightforward with the DEWA calculator.
💧 DEWA Water Tariff
DEWA water is also tiered. Specifically, the first 6,000 gallons per month for UAE nationals (and first 3,500 for expatriates) is charged at AED 2.00 per thousand gallons. Above these thresholds, the rate increases progressively. Furthermore, desalination makes UAE water production one of the most energy-intensive in the world — approximately 4 to 10 kWh per cubic metre of water produced, meaning water consumption has an indirect carbon footprint in addition to the direct utility cost. Consequently, reducing water consumption in the UAE has both a financial and a meaningful environmental benefit.
Free Energy and Power Converter: kWh, BTU, MJ, Watts and More in One Tool
The Energy and Power Converter handles conversions between all major energy and power units — essential when comparing energy sources, reading technical specifications or working with data from multiple countries that use different measurement systems. Specifically, it covers energy units (kWh, MJ, BTU, calories, kcal, therms, kJ, Wh, toe — tonnes of oil equivalent) and power units (W, kW, MW, GW, BTU/hr, horsepower) simultaneously in a single input.
📐 Key Conversion Factors
- 1 kWh = 3.6 MJ = 3,412 BTU = 860 kcal
- 1 therm (natural gas) = 29.3 kWh = 105.5 MJ
- 1 tonne of oil equivalent (toe) = 11,630 kWh = 41.87 GJ
- 1 kilowatt (kW) = 1,000 watts = 3,412 BTU/hour
- 1 horsepower = 0.746 kW = 2,545 BTU/hour
Specifically, these conversions are critical when comparing solar panel output (typically quoted in kWp and kWh) with gas boiler consumption (typically quoted in therms or MJ), or when converting appliance specifications between US (BTU/hr for air conditioners) and European (kW) standards. Furthermore, energy consultants working on carbon accounting need to convert between units when aggregating Scope 1 and 2 emissions from fuel consumption data that arrives in different formats from different facilities.
What Is a Good Carbon Footprint? Country Benchmarks and the 2030 Target
| Country / Region | Avg tCO2e/person/yr | Electricity grid factor | vs 1.5°C target (2.3 t) |
|---|---|---|---|
| UAE | 20.0 | 0.386 kgCO2e/kWh | 769% over target |
| USA | 14.5 | 0.386 kgCO2e/kWh | 530% over target |
| Australia | 13.4 | 0.512 kgCO2e/kWh | 483% over target |
| UK | 5.5 | 0.233 kgCO2e/kWh | 139% over target |
| EU Average | 7.5 | 0.255 kgCO2e/kWh | 226% over target |
| India | 1.9 | 0.708 kgCO2e/kWh | 18% under target |
| Global average | 4.0 | Varies | 74% over target |
| IPCC 1.5°C target (2030) | 2.3 | — | — |
Sources: IEA World Energy Outlook 2025; IPCC Sixth Assessment Report; UK Government BEIS 2025 Greenhouse Gas Conversion Factors.
A Step-by-Step Sustainability Audit Using All Five Tools
The five tools work as a complete sustainability measurement workflow when used in sequence. Specifically, starting with the broadest measure and progressively drilling into the highest-impact categories produces an actionable picture of where to focus reduction efforts. Furthermore, this workflow is suitable for both individuals conducting a personal audit and for small businesses measuring their operational footprint.
Five Sustainability Measurement Mistakes That Produce Misleading Results
❌ Mistake 1: Using National Average Electricity Factors for All Regions
The UAE national average electricity emission factor (0.386 kgCO2e/kWh) is significantly higher than the UK's (0.233 kgCO2e/kWh) and dramatically higher than countries with high renewable penetration like Norway (0.013 kgCO2e/kWh). Specifically, using the wrong grid factor in a carbon footprint calculation can cause errors of 3x or more in the electricity category. Furthermore, within countries, regional factors vary — California's grid is significantly cleaner than Texas's grid in the United States. Consequently, always use the correct country-specific emission factor for electricity calculations.
❌ Mistake 2: Ignoring Embodied Carbon in New Purchases
The manufacture of new goods — particularly electronics and vehicles — carries a significant carbon cost that is often excluded from personal footprint calculations. Specifically, manufacturing a new mid-range smartphone generates approximately 70 kg of CO2e, and manufacturing a new medium-sized car generates approximately 6 to 35 tCO2e depending on whether it is a conventional or electric vehicle. Furthermore, buying a new electric car and attributing zero emissions to it ignores the manufacturing carbon — which for a battery electric vehicle can take 1 to 3 years of driving to offset through lower operational emissions. Consequently, reducing consumption of new goods is frequently more impactful than switching to greener versions of the same goods.
❌ Mistake 3: Calculating Electricity Cost from Kilowatts Instead of Kilowatt-Hours
Kilowatts (kW) measure power — the rate of energy use at a moment in time. Kilowatt-hours (kWh) measure energy — the total amount consumed over time. Specifically, a 2 kW kettle running for 3 minutes consumes 0.1 kWh (2 kW × 3/60 hours), not 2 kWh. Electricity bills are measured in kWh and electricity tariffs are priced per kWh. Consequently, always multiply the appliance's power rating in kW by the hours of use to get kWh before applying the tariff.
❌ Mistake 4: Treating Fuel Efficiency Figures as Real-World Values
Manufacturer-stated fuel efficiency figures are measured under standardised laboratory test conditions that typically overstate real-world efficiency by 15 to 25%. Specifically, air conditioning use, highway driving speeds above 100 km/h, cold weather and stop-start urban driving all degrade fuel efficiency relative to lab conditions. Furthermore, vehicle age and maintenance significantly affect real-world efficiency. Consequently, use your actual measured fuel consumption (litres per fill and kilometres driven) in the Fuel Cost Calculator rather than the manufacturer's quoted figure for accurate cost and emissions calculations.
❌ Mistake 5: Measuring Only Scope 1 Emissions for Business
For businesses, carbon accounting defines three scopes. Scope 1 covers direct emissions from owned or controlled sources (company vehicles, on-site gas boilers). Scope 2 covers purchased electricity and heat. Scope 3 covers all other indirect emissions across the value chain — employee commuting, business travel, supply chain production, product use and disposal. Specifically, for most service businesses, Scope 3 represents 70 to 95% of the total carbon footprint. Consequently, a sustainability measurement programme that only measures Scope 1 (direct fuel use) produces a figure that represents as little as 5% of the real total.
How AI Is Changing Sustainability Measurement and Carbon Accounting
Artificial intelligence is accelerating the pace and precision of sustainability measurement — reducing the time and expertise required to produce accurate carbon footprint calculations and making real-time monitoring accessible to organisations that previously lacked the resources for it.
📊 AI for Automated Carbon Data Extraction
Manual carbon footprint calculation requires collecting energy bills, fuel receipts, travel records and supply chain data from dozens of sources, converting them to consistent units and applying the correct emission factors. Specifically, AI document processing platforms including Watershed, Persefoni and Greenly now use machine learning to extract relevant data automatically from utility bills, expense receipts and ERP system exports — reducing the data collection time for an annual corporate carbon footprint from weeks to hours. Furthermore, these platforms use LLM-based data classification to categorise spend into the correct emission factor category without manual mapping. Consequently, AI is making systematic carbon accounting accessible to mid-market businesses for the first time.
🌍 AI for Climate Scenario Modelling
Large language models combined with climate science databases are enabling organisations to model the physical risk of climate change to their specific operations — flood risk at facility locations, supply chain disruption probability under different warming scenarios, and regulatory risk under different carbon price trajectories. Specifically, tools including ClimateAI, Jupiter Intelligence and MSCI Climate Risk tools use AI to translate global climate scenarios into facility-specific risk assessments. Furthermore, the IPCC's Sixth Assessment Report data has been used to fine-tune specialised climate risk models that LLMs can query in natural language. Consequently, the strategic sustainability planning that previously required specialist climate consultants is increasingly accessible through AI-augmented tools.
Sustainability Calculator Questions Answered Directly
What is the most effective single action to reduce my carbon footprint?
For people in high-income countries, the most impactful single category change is typically diet — specifically, reducing beef and lamb consumption. A shift from a meat-heavy diet to a plant-based diet reduces the dietary component of a carbon footprint by approximately 1.5 to 2.5 tCO2e per year. Furthermore, for people in warm climates where air conditioning dominates electricity bills, reducing cooling by 2°C (from 20°C to 22°C) reduces air conditioning electricity consumption by approximately 6% per degree, which translates to meaningful annual savings in both cost and emissions at scale.
How do I reduce my DEWA electricity bill in Dubai?
The most impactful DEWA cost reduction strategies are: (1) Raise the air conditioning thermostat from 20°C to 24°C — each degree increase saves approximately 6% of cooling electricity. (2) Replace older, low-efficiency air conditioning units with modern inverter-type units (5-star rated), which reduce consumption by 30 to 50% for the same cooling output. (3) Time large appliance use (dishwashers, washing machines, water heaters) to avoid peak periods. (4) Insulate windows and doors to reduce cooling load. Specifically, in the UAE context, reducing monthly consumption from 5,500 kWh to below 4,000 kWh moves consumption out of the highest tariff bands, producing a disproportionately large bill reduction.
Is electric vehicle charging cheaper than petrol in the UAE?
At current UAE petrol prices (ADNOC/ENOC prices around AED 3.00-3.15 per litre in 2026) and DEWA EV charging tariffs (AED 0.29/kWh at public chargers, lower at home), an EV covering 15,000 km per year costs approximately AED 650 to 900 in electricity, compared to approximately AED 3,750 to 4,500 in petrol for an equivalent petrol car — a saving of approximately AED 3,000 per year. Furthermore, EVs emit approximately 6 kg CO2 per 100 km on the UAE grid compared to approximately 19 kg for an average petrol car, making them approximately 68% cleaner on the current UAE grid.
Authoritative Sources on Carbon Footprints and Sustainability Measurement
📊 Emission Factors and Standards
- UK Government BEIS Greenhouse Gas Conversion Factors — The authoritative annual publication of emission factors used by this calculator and by professional carbon accountants globally
- IPCC Sixth Assessment Report (AR6) Synthesis — The scientific basis for the 2.3 tCO2e per person 1.5°C-compatible target and global emissions pathways
- IEA World Energy Outlook 2025 — Country-level energy statistics and grid emission factors used in the country benchmarks table
🇦🇪 UAE-Specific Resources
- DEWA Official Tariff Schedule — The current DEWA electricity and water tariff bands for residential and commercial customers
- UAE Ministry of Climate Change and Environment — UAE national climate targets, Net Zero 2050 strategy and environmental regulations
- IRENA Renewable Power Generation Costs 2024 — International Renewable Energy Agency data on solar and wind levelised costs used in UAE energy planning
🌍 Science-Based Targets and Carbon Accounting
- Science Based Targets Initiative (SBTi) — The standard for corporate net-zero commitments and Scope 1, 2 and 3 emissions measurement requirements
- GHG Protocol Corporate Standard — The most widely used international accounting framework for corporate greenhouse gas reporting
- Bryngelsson et al. — Nature Climate Change, Individual Carbon Footprint Reduction Study — The peer-reviewed research showing 19% emissions reduction in individuals who measured their footprint
Frequently Asked Questions About Sustainability Calculators
Carbon and Emissions
Fuel and Energy
Sustainability Measurement in 2026: Mandates, AI and the Net Zero Transition
Three forces are reshaping sustainability measurement from a voluntary activity to a structured requirement in 2026 — regulatory mandates, the AI automation of carbon accounting and the growing commercial consequences of sustainability performance.
📋 Expanding Mandatory Disclosure Requirements
Corporate sustainability reporting is transitioning from voluntary best practice to legal obligation across major economies. Specifically, the EU's Corporate Sustainability Reporting Directive (CSRD) now requires approximately 50,000 companies — including non-EU companies with significant EU operations — to disclose detailed sustainability metrics annually from 2024 onwards. Furthermore, the SEC's climate disclosure rules in the United States (currently subject to legal challenge but progressing) would require listed US companies to disclose Scope 1 and 2 emissions, with Scope 3 required for large companies where material. Additionally, the UAE's Securities and Commodities Authority has issued ESG disclosure guidance for listed companies, and Dubai Financial Market listed companies face increasing investor pressure for climate data. Consequently, the ability to measure, calculate and report carbon emissions accurately is becoming a non-negotiable business capability.
☀️ The UAE's Net Zero by 2050 Strategy
The UAE committed to Net Zero by 2050 at COP26, with an interim target of reducing carbon intensity by 70% by 2050 relative to 2021 levels. Specifically, the UAE's Energy Strategy 2050 targets 44% renewable energy in the power mix by 2050, up from approximately 14% in 2024. Furthermore, Abu Dhabi's Masdar City project and Dubai's Mohammad bin Rashid Al Maktoum Solar Park (5 GW eventual capacity) are the physical infrastructure of this transition. Consequently, individual and business energy consumption choices in the UAE are increasingly occurring in a policy environment that prices and regulates carbon, making sustainability measurement tools directly useful for navigating these changing conditions.