
explainer
Financial Ratios Explained: The 6 Families and How to Read Them
By Uttam Regmi · Published 2026-07-12 · Updated 2026-07-12 · 7 min read · Fact-checked, sources cited
A financial ratio on its own tells you almost nothing. A current ratio of 1.2, a net margin of 8%, a P/E of 22, each is just a number until you compare it to a benchmark, to competitors, or to where the company was last year. The skill isn’t calculating ratios; it’s reading them. This guide walks through the six families, what each answers, and, crucially, which have universal benchmarks and which only make sense against peers.
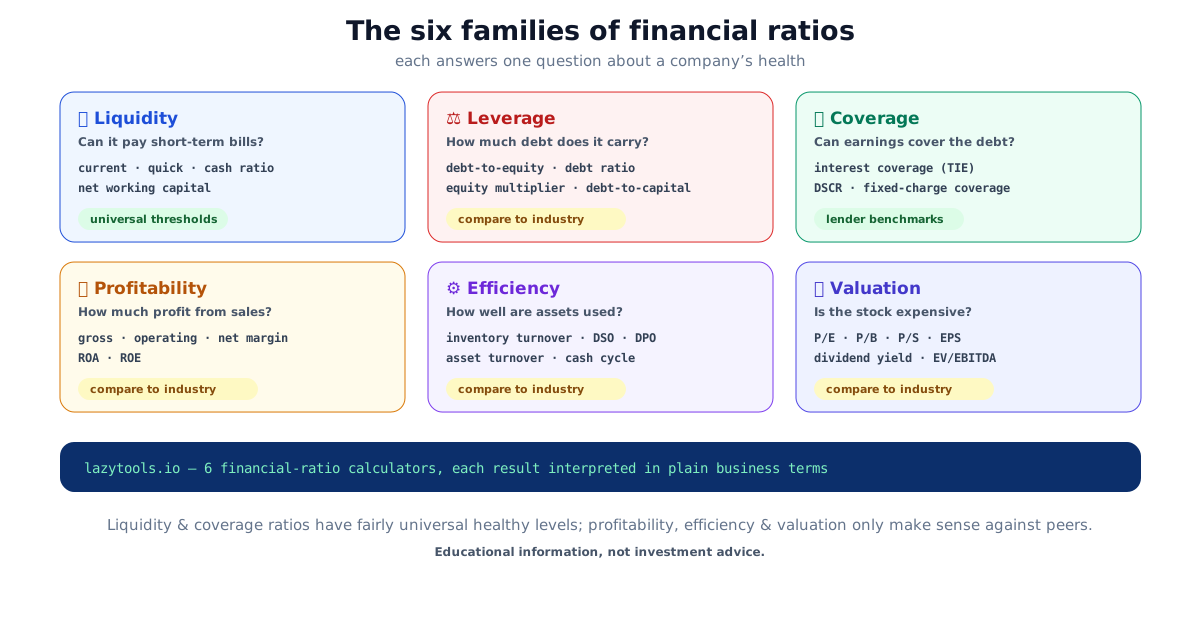
The one-page map of all six families
Before the detail, here’s the whole landscape on a single line each, the question it answers, the headline ratios, and whether a rule-of-thumb benchmark travels across industries or you have to compare to peers.
| Family | Question it answers | Headline ratios | Universal benchmark? |
|---|---|---|---|
| Liquidity | Can it pay bills due within a year? | Current, quick, cash ratio | Mostly yes (with sector exceptions) |
| Leverage | How much of the business is debt-funded? | Debt-to-equity, debt ratio | No, heavily industry-dependent |
| Coverage | Can earnings actually service that debt? | Interest coverage, DSCR | Yes, lender rules of thumb |
| Profitability | How much profit per dollar of sales/assets? | Margins, ROA, ROE | No, compare to peers |
| Efficiency | How hard do the assets work? | Turnover ratios, DSO, cash cycle | No, compare to peers |
| Valuation | Is the stock cheap or expensive? | P/E, P/B, EV/EBITDA, yield | No, compare to peers and growth |
Notice the pattern: only liquidity and coverage carry benchmarks that mean roughly the same thing everywhere, because they map to survival and to what a lender will accept. The other four are relative measures, a number is only “good” next to a comparable company. Keep that split in mind as you read on.
1. Liquidity, can it pay the short-term bills?
Liquidity ratios test whether a company can cover obligations due within a year from its short-term resources.
- Current ratio = current assets ÷ current liabilities. Healthy is often cited as ~1.5-3; below 1 means short-term assets don’t cover short-term debts.
- Quick (acid-test) ratio strips out inventory (the slowest asset to sell), 1 or more means the firm can pay its bills without a fire sale of stock.
- Cash ratio counts only cash and equivalents; 0.2 or higher is generally comfortable.
- Net working capital = current assets − current liabilities, the cushion in dollars.
Worked example. A retailer has $600,000 of current assets ($200,000 of it inventory) against $400,000 of current liabilities. Current ratio = 600 ÷ 400 = 1.5, comfortable. Quick ratio strips the inventory: (600 − 200) ÷ 400 = 1.0. It can still meet its bills without selling a single item off the shelf. Those two numbers together tell a fuller story than either alone: solvent on paper, and not dangerously dependent on shifting stock.
These are among the more universal ratios, but context still matters, a current ratio below 1 is normal for a supermarket that sells inventory before paying suppliers. Try the liquidity ratios calculator.
2. Leverage, how much debt is behind the business?
Leverage (solvency) ratios show how much a company relies on borrowed money.
- Debt-to-equity = debt ÷ equity. A rough band is 1-2 for many industries; higher means more financial risk.
- Debt ratio = debt ÷ assets, the share of assets funded by debt (under ~0.5 is conservative).
- Equity multiplier = assets ÷ equity, and debt-to-capital = debt ÷ (debt + equity).
Leverage is strongly industry-dependent: utilities, telecoms and banks safely carry far more debt than software firms. Compare to peers, and note whether “debt” means total liabilities or only interest-bearing debt. Leverage ratios calculator.
3. Coverage, can earnings actually service the debt?
Leverage shows how much debt; coverage shows whether it’s affordable. These are the ratios lenders scrutinise, so their thresholds are among the most consistent.
- Interest coverage (times interest earned) = EBIT ÷ interest. Above ~2.5-3× is generally safe; below 1.5× is risky.
- Debt service coverage ratio (DSCR) = net operating income ÷ total debt payments. Lenders typically want ≥1.25×; below 1 means operations can’t cover the debt.
- Fixed-charge coverage adds leases and other fixed obligations, with covenant floors often around 1.2-1.25×.
Worked example. A firm earns $500,000 of EBIT and pays $100,000 of interest. Interest coverage = 500 ÷ 100 = 5×, earnings could fall by roughly 80% before interest became unaffordable, which is why lenders sleep at 5× and worry below ~1.5×. The same company generating $250,000 of net operating income against $200,000 of annual debt payments has a DSCR of 250 ÷ 200 = 1.25×, right at the line most lenders draw. Coverage ratios are so consistent precisely because they encode what creditors are willing to fund.
4. Profitability, how much profit from each dollar?
Profitability ratios measure how much profit a company wrings from sales, assets and equity.
- Gross / operating / net margin, profit after direct costs, after operating costs, and after everything.
- Return on assets (ROA) = net income ÷ assets; Return on equity (ROE) = net income ÷ equity.
Here there is no universal “good” number, software nets 20-30%+ while grocery nets 2-6%, and asset-light firms post far higher returns than utilities. Judge against industry peers and the company’s own trend, and remember a high ROE can be driven by leverage rather than efficiency.
That last point is worth unpacking. The DuPont breakdown splits ROE into three levers: net margin × asset turnover × equity multiplier. Two companies can both post a 20% ROE, but one earns it from fat margins and light debt while the other earns it from thin margins amplified by heavy borrowing. The headline number is identical; the risk is not. This is exactly why a profitability ratio must be read alongside the leverage family rather than in isolation. Profitability ratios calculator.
5. Efficiency, how hard do the assets work?
Efficiency (activity) ratios show how well a company turns assets and working capital into sales and cash.
- Inventory turnover (and days inventory outstanding), receivables turnover / DSO (days to collect), payables turnover / DPO (days to pay).
- Asset turnover = revenue ÷ assets.
- Cash conversion cycle = DIO + DSO − DPO, days to turn cash spent on inventory back into cash from customers. Shorter is better; negative means suppliers effectively fund your operations.
All are industry-relative, grocers turn inventory many times a year, machinery makers slowly. Efficiency ratios calculator.
6. Valuation, is the stock expensive?
Valuation (market) ratios relate share price and enterprise value to the fundamentals.
- P/E (price ÷ earnings), P/B (price ÷ book value), P/S (price ÷ sales), EPS.
- Dividend yield and the payout ratio (a payout above 100% is unsustainable).
- EV/EBITDA, a debt-neutral multiple, often reasonable below ~10.
These only mean something versus sector peers, history and growth, a P/E of 30 is cheap for a fast grower and dear for a utility. Valuation ratios calculator.
How to actually read a ratio
Whatever the ratio, interpret it three ways:
- Against a benchmark, where a universal one exists (mostly liquidity and coverage).
- Against industry peers, essential for profitability, efficiency and valuation.
- Against the company’s own trend, direction often matters more than level.
And read families together: a business can look profitable yet be dangerously leveraged, or cheap on P/E yet burning cash. Each LazyTools ratio calculator computes the whole family at once and interprets every result in plain business terms, with a healthy / caution / concern read where a universal benchmark exists, and a “compare to peers” flag where it doesn’t. Everything runs in your browser; nothing you type is uploaded.
Educational information, not investment or financial advice. Formulas are standard accounting definitions; interpretation benchmarks are widely-cited rules of thumb that vary by industry and over time, always compare to peers and trend. Sources: Corporate Finance Institute, Investopedia, Financial Ratios, and standard lender underwriting benchmarks (interest coverage, DSCR).
Frequently asked questions
What are the main types of financial ratios?
Six families: liquidity (can it pay short-term bills?), leverage/solvency (how much debt?), coverage (can earnings cover the debt?), profitability (how much profit from sales and assets?), efficiency/activity (how well are assets used?), and valuation/market (is the stock expensive?).
What is a good current ratio?
Roughly 1.5 to 3 is often cited as healthy, enough current assets to cover current liabilities comfortably. Below 1 is a warning; well above 3 can mean idle assets. It varies by industry, so fast-turnover retailers can run lower.
Which financial ratios have universal benchmarks?
Mainly the liquidity and coverage ratios, they're solvency and lender rules of thumb (current ratio ~1.5-3, interest coverage above ~2.5-3×, DSCR ≥1.25). Profitability, efficiency and valuation ratios are heavily industry-dependent and must be compared to peers.
Why can't I just compare a company's P/E or profit margin to a single 'good' number?
Because those vary enormously by sector. Software margins dwarf grocery margins; a P/E of 30 is cheap for a fast grower and expensive for a utility. For these ratios, compare to industry peers, the company's own history, and its growth rate.
How do I actually interpret a financial ratio?
Three comparisons: against a rule-of-thumb benchmark (where one exists), against industry peers, and against the company's own trend over time. A ratio moving in the wrong direction is often more telling than its absolute level.
Are financial ratios enough to evaluate a company?
No, they're a starting point. Read several families together (a company can look profitable but be dangerously leveraged), alongside the cash-flow statement, the business model and qualitative factors. Ratios flag questions to investigate, not final answers.