
explainer
How Many People Do You Need to Survey? Sample Size Explained
By Uttam Regmi · Published 2026-07-11 · Updated 2026-08-23 · 6 min read · Fact-checked, sources cited
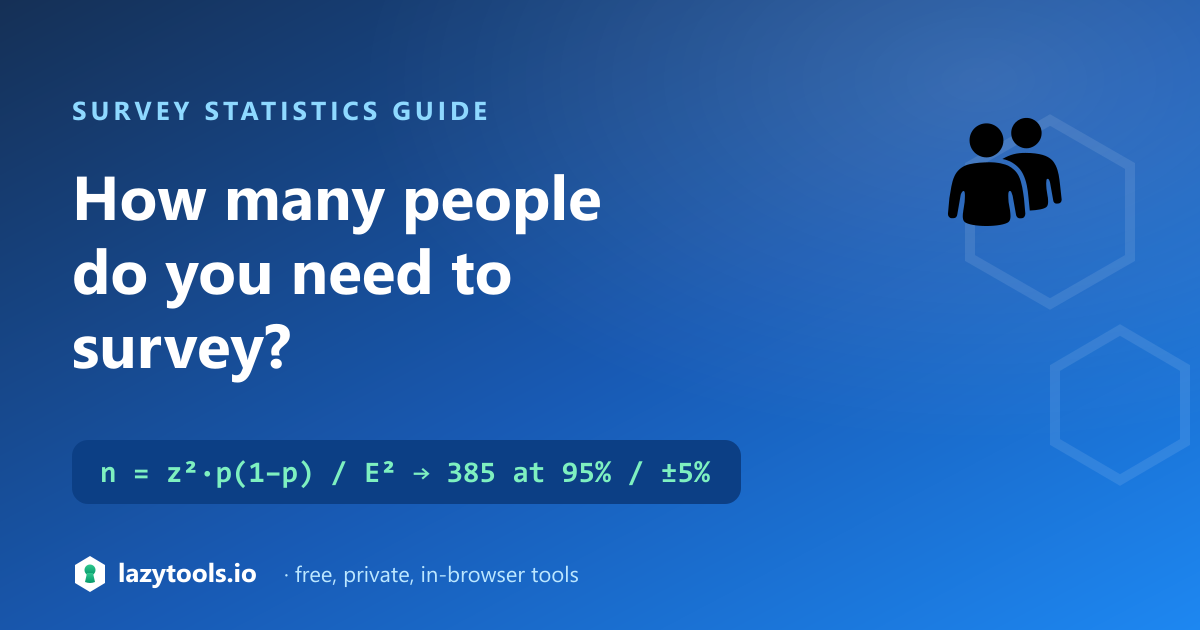
For a survey, the sample size you need is n = z²·p(1−p) / E². Plug in the standard 95% confidence
(z = 1.96), the conservative proportion p = 0.5, and a ±5% margin of error, and you get 385 responses
, the number behind almost every “we surveyed ~400 people” you have ever read. Remarkably, that figure
barely changes whether your population is a town of 20,000 or a country of 20 million.
The formula and a worked example
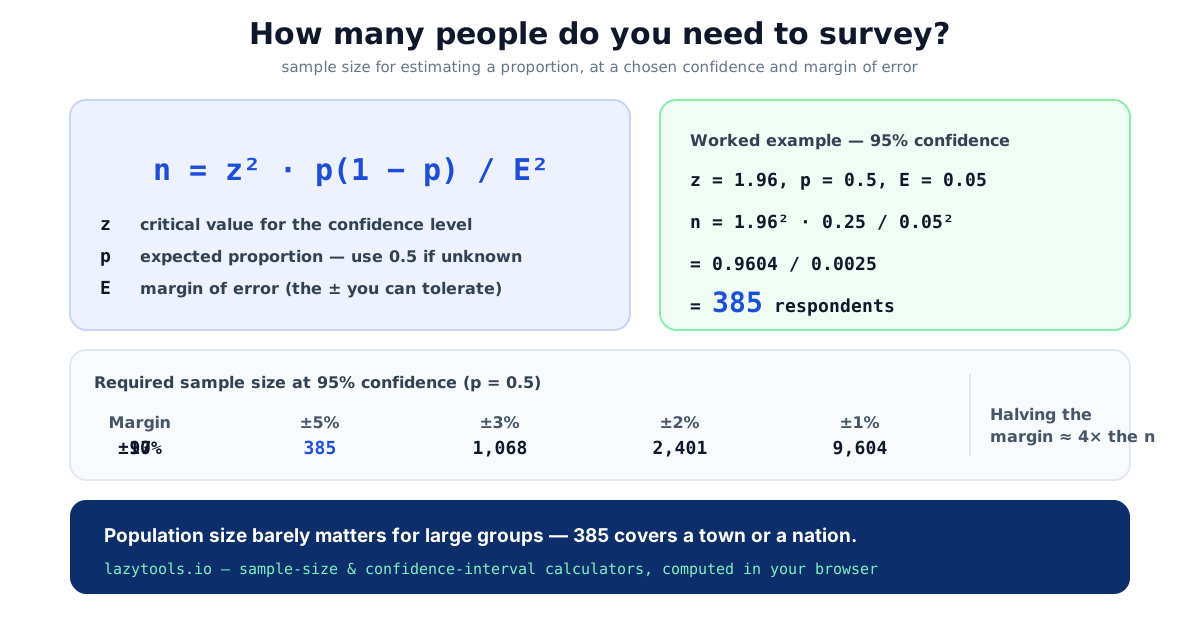
Three quantities go in:
- z, the critical value for your confidence level (1.96 for 95%, from the normal distribution).
- p, the proportion you expect to find (the share who say “yes”). Use 0.5 if you have no idea.
- E, the margin of error you can live with (the ± band around your result).
At 95% confidence with p = 0.5 and E = 0.05:
n = 1.96² × 0.5 × 0.5 / 0.05² = 0.9604 / 0.0025 = 384.16 → 385
Always round up. You cannot survey a fraction of a person, and rounding down would widen your margin.
Why 0.5 is the safe default
The only place your unknown answer enters the formula is the term p(1 − p), and that product is largest when p = 0.5 (it equals 0.25). Any other value, 0.3, 0.8, makes it smaller and so demands fewer respondents. By assuming 0.5 you compute the worst case, guaranteeing your realised margin of error will be no worse than you planned no matter how the responses actually split. If you have solid prior data (say a previous poll found 15%), you can plug that in and justify a smaller sample.
How the margin of error drives the cost
Because E is squared in the denominator, precision is expensive:
| Margin of error (95% conf.) | Responses needed |
|---|---|
| ±10% | 97 |
| ±5% | 385 |
| ±3% | 1,068 |
| ±2% | 2,401 |
| ±1% | 9,604 |
Halving the margin, from ±5% to ±2.5%, roughly quadruples the sample. This is the single most important intuition to carry into planning: a modestly tighter estimate can cost several times as many responses. The sample-size calculator lets you slide the margin and watch n move before you commit a budget.
The confidence level changes z, and n
The other dial is the confidence level, which sets z. Higher confidence means you want to be more certain the true value falls inside your ± band, so z grows and the sample grows with z². The critical values below are the standard two-sided ones you will see quoted everywhere; the sample sizes assume the worst-case p = 0.5 and a fixed ±5% margin.
| Confidence level | Critical value z | Responses needed (±5%, p = 0.5) |
|---|---|---|
| 90% | 1.645 | 271 |
| 95% | 1.960 | 385 |
| 99% | 2.576 | 664 |
Moving from 95% to 99% confidence, a jump that sounds small, pushes the sample from 385 to 664, about 70% more responses, for the same margin. Most consumer and business surveys settle on 95% precisely because it balances rigour against cost; 90% is common for quick internal reads, and 99% is reserved for higher-stakes work such as medical or safety research.
The counter-intuitive part: population size
Most people assume surveying a country needs a far bigger sample than surveying a company. It doesn’t. The basic formula has no population term at all, 385 responses give a ±5% margin whether you are sampling 20,000 people or 20 million. Population size only enters through the finite-population correction, which reduces the required sample when it would otherwise be a large fraction of a small group. Surveying 500 people about a 600-member club? The correction meaningfully lowers n. Surveying a city? It changes nothing worth noting.
The correction is n_adj = n / (1 + (n − 1) / N), where n is the basic (infinite-population) number and
N is your population. For a 600-member club at 95%/±5%:
n_adj = 385 / (1 + (385 − 1) / 600) = 385 / 1.64 ≈ 235
So you would need roughly 235 of the 600 members, not 385, a real saving. Run the same correction for a city of 600,000 and the divisor is essentially 1, so n stays at 385. As a rule of thumb, the correction only earns its keep once your sample would exceed about 5% of the population.
How many people to actually invite
The formula gives completed responses, not invitations. Real surveys have a response rate well below 100%, so divide your target n by the expected response rate to size the invite list:
invites ≈ n / response rate
If you need 385 completes and expect a 30% response rate, plan to reach about 385 / 0.30 ≈ 1,283 people. Under-inviting is the most common reason a survey lands with a wider margin than promised. You budgeted for the completes but not for the no-shows. Build the buffer in from the start.
Common mistakes to avoid
- Reporting a tighter margin than your completes support. If only 300 people finished, your true margin is wider than the ±5% you designed for; recompute it from the responses you actually got.
- Forgetting subgroups. A sample of 385 gives ±5% for the whole group, but a slice of 40 respondents (say, one age band) carries a much larger margin. Size up if you need to report on subgroups.
- Confusing response count with representativeness. A large sample that over-represents one segment is biased, not accurate. Sample size controls precision; sampling method controls bias. They are separate problems, and no amount of extra responses fixes a skewed frame.
From sample size to confidence interval
Sample size and confidence interval are the same calculation run in opposite directions. Sample size asks “how many responses for this margin?”; a confidence interval asks “given the responses I collected, what is the margin?” Plan with one, report with the other, and both rest on the same critical z from the normal distribution.
Quick summary
Survey sample size for a proportion is n = z²·p(1−p) / E². For the everyday case, 95% confidence, ±5%
margin, unknown proportion, that is 385 respondents, and it holds across almost any large population.
Use p = 0.5 when unsure, remember that halving the margin quadruples the sample, and only worry about
population size for small groups. Work out your own number with the
sample-size calculator.
Sources: the standard sample-size formula for estimating a proportion (Cochran’s formula) and the finite-population correction, as taught in introductory statistics and survey methodology. Educational information, not a substitute for a statistician on a high-stakes study.
Frequently asked questions
How many people do I need to survey?
Use n = z²·p(1−p) / E². For the usual 95% confidence, a ±5% margin of error and the conservative p = 0.5, you need about 385 responses. Tighten the margin to ±3% and it rises to about 1,068; loosen it to ±10% and it falls to about 97.
Why is 385 the magic survey number?
It is n = 1.96² × 0.5 × 0.5 / 0.05² = 384.16, rounded up. That combination, 95% confidence, ±5% margin, and the worst-case proportion of 0.5, is the default for a general-population survey, which is why 385 (often quoted as ~400) appears so often.
What proportion (p) should I use if I don't know it?
Use 0.5. The term p(1−p) is largest at p = 0.5, so it produces the biggest, most conservative, sample size. That guarantees your margin of error will be no worse than planned, whatever the true proportion turns out to be. If you have a reliable prior estimate far from 0.5, a smaller sample suffices.
Does the size of my population matter?
Surprisingly little for large populations. A 95%/±5% survey needs about 385 responses whether the population is 20,000 or 20 million. Population size only matters, via the finite-population correction, when your sample is a large fraction of a small population.
How does the margin of error change the sample size?
The sample size grows with the inverse square of the margin: n ∝ 1/E². Halving the margin of error (say from ±5% to ±2.5%) roughly quadruples the number of responses you need. That is why very tight margins get expensive fast.
Is a bigger sample always more statistically significant?
A bigger sample narrows the margin of error and makes estimates more precise, but 'significance' is about a specific hypothesis test, not sample size alone. Past the point where your margin is tight enough for the decision at hand, extra responses add little, which is exactly what the sample-size formula tells you.