
explainer
What Is a Swimlane Diagram? Mapping Who Does What (and Where Work Stalls)
By Uttam Regmi · Published 2026-07-17 · Updated 2026-07-17 · 6 min read · Fact-checked, sources cited
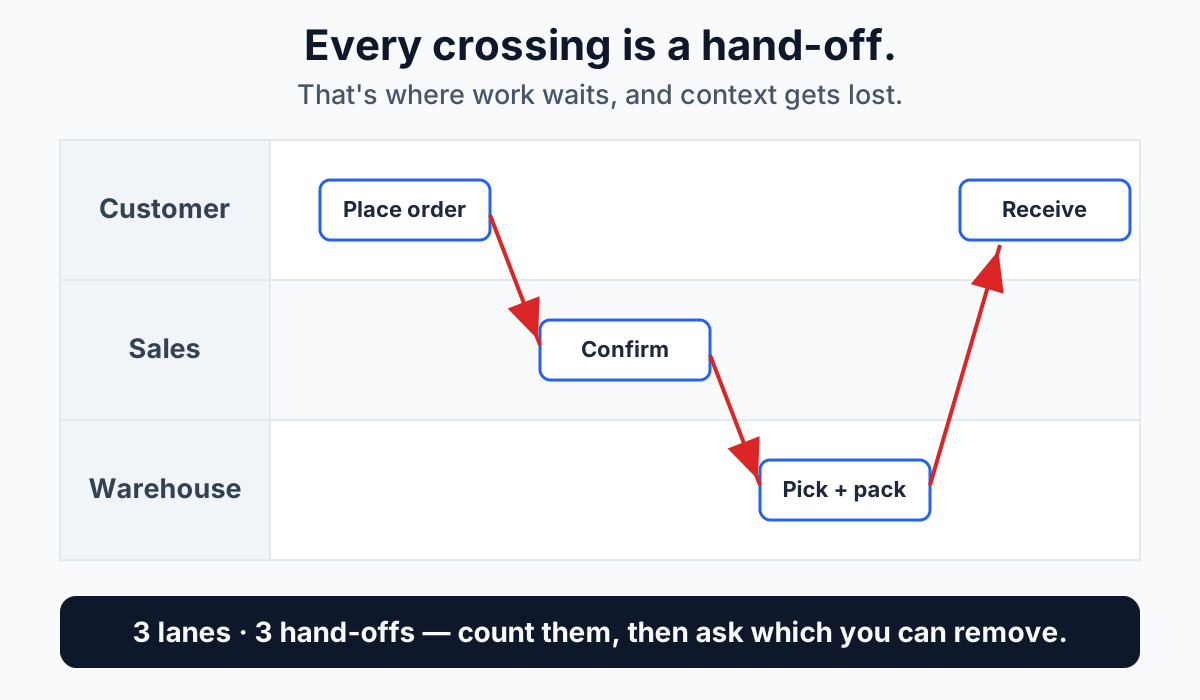
A swimlane diagram is a process flowchart divided into lanes, where each lane is one person, team, department or system. Every step sits in the lane of whoever performs it, so the diagram shows not just what happens but who is responsible, and every time work passes between roles, the arrow visibly crosses a lane boundary. Those crossings are the point: hand-offs are where most processes lose time, and a swimlane makes them impossible to overlook.
Why lanes change what you see
Take one step: Sales passes a qualified lead to Finance for credit approval.
In an ordinary flowchart, that’s one box among many, visually identical to every other box. In a swimlane diagram, it’s an arrow that leaves the Sales lane and enters the Finance lane. It crosses a line on the page, and everyone in the room sees it.
That difference matters because hand-offs are where processes decay. Work waits in a queue, context gets lost in the translation between teams, and nobody owns the gap between two owners. A format that renders hand-offs as boundary crossings lets you do three things a flowchart can’t:
- Count them. Fifteen crossings in a five-day process is a finding, not a diagram.
- Question them. Does this step genuinely need a different team, or is that just history?
- Locate delay. Ask where work waits, and it’s almost always at a crossing, not inside a lane.
When a swimlane is the right format
Reach for a swimlane when more than one role shares responsibility and the ownership is the interesting part. It suits:
- Order fulfilment, customer, sales, warehouse, courier
- Employee onboarding, recruiting, HR, IT, the hiring manager
- Approvals, requester, budget holder, finance, legal
- Support escalation, customer, tier 1, engineering
- Vendor management, procurement, legal, security, finance
Stick with a plain flowchart when the process stays inside one role, or when the branching logic, not the ownership, is what you’re working out. A swimlane with one lane is just a flowchart with extra lines.
How to build one that people actually use
1. Fix the start and end first. Write the trigger and the finished outcome before drawing anything. Most bad process maps are bad because the boundaries were never agreed.
2. Name lanes by role, not by person. “Accounts Payable,” not “Priya.” People change jobs; the process outlives them. It also stops the diagram reading as a performance review.
3. Keep it to 3-7 lanes. Beyond about seven, arrows criss-cross so heavily the diagram becomes decorative. If you genuinely have more actors, either raise the abstraction level (group into departments) or split into linked sub-processes.
4. Use standard shapes. Rectangles for activities, diamonds for decisions, rounded shapes for start and end. Consistency means a newcomer can read it without a key.
5. Map what actually happens, not the policy. The value of process mapping comes from the gap between the documented process and the real one. Draw the real one, including the workaround everybody uses.
6. Then count the crossings. Once it’s drawn, the review question isn’t “is this pretty”, it’s “which of these hand-offs can we remove?”
You can do all of this in the swimlane diagram maker: add a lane per role, drop in steps, drag them between lanes, and connect them to draw the flow. It runs entirely in your browser and exports PNG, PDF or JSON.
Lanes vs pools: the BPMN distinction
If you move from sketching into formal modelling, you’ll meet BPMN (Business Process Model and Notation), where the distinction between lanes and pools is precise:
| Represents | Example | |
|---|---|---|
| Lane | A role, team or system within one organisation | Sales, Finance, the billing system |
| Pool | A separate organisation or entity with its own process | Your company vs the customer vs a supplier |
The practical rule: participants who share your process infrastructure are lanes; independent parties who run their own process and merely exchange messages with you are pools.
For most teams this distinction only matters once you’re automating. A swimlane diagram is for understanding and aligning on a process; full BPMN is for building, automating and optimising it at a system level. Start with the swimlane, if the process later needs to run in software, the mapping you did will translate.
Horizontal or vertical lanes?
Either works. Horizontal lanes (rows) are the most common in English-language documentation because the process reads left to right along a timeline, matching reading direction. Vertical lanes (columns) suit processes with many steps per role, or documents printed in portrait. Pick one and stay consistent across a set of diagrams.
Frequently asked questions
What is a swimlane diagram used for?
Mapping a process that crosses several roles, teams or systems, order fulfilment, onboarding, approvals, escalations. It shows the sequence of steps and who owns each one, making hand-offs between groups visible so you can find where work stalls.
What is the difference between a flowchart and a swimlane diagram?
A flowchart shows the sequence of steps and decisions. A swimlane diagram adds lanes that assign each step to a role or team, so responsibility and hand-offs become explicit. Use a flowchart for logic within one role; use a swimlane when ownership crosses boundaries.
How many lanes should a swimlane diagram have?
Three to seven for most diagrams. Fewer than three and a plain flowchart is simpler; more than seven and the crossing arrows overwhelm the reader. If you need more actors, group them into departments or split the process into linked sub-diagrams.
What is the difference between a lane and a pool in BPMN?
Lanes represent roles, teams or systems inside a single organisation that share the same process. Pools represent separate organisations or entities, your company and an external supplier, for example, that run their own processes and interact by exchanging messages.
Should lanes be named after people or roles?
Roles, always. “Accounts Payable” rather than an individual’s name. Roles outlast the people filling them, keep the diagram accurate through staff changes, and keep the conversation about the process rather than about individuals.
Why are hand-offs so important in process mapping?
Because that’s where delay and error concentrate. Work sits in a queue waiting for the next team, context is lost in translation, and no single person owns the gap. Counting cross-lane arrows gives you a concrete list of candidates to eliminate or automate.
Is a swimlane diagram the same as a cross-functional flowchart?
Yes. “Swimlane diagram,” “cross-functional flowchart” and “Rummler, Brache diagram” all describe the same thing: a flowchart partitioned into lanes by responsible role.
Frequently asked questions
What is a swimlane diagram?
A swimlane diagram is a process flowchart divided into lanes, where each lane represents one role, team, department or system. Every step sits in the lane of whoever performs it, so the diagram shows who is responsible and makes every hand-off between roles a visible cross-lane arrow.
What is another name for a swimlane diagram?
It is also called a cross-functional flowchart or a Rummler-Brache diagram. All three terms describe the same thing: a flowchart partitioned into lanes by responsible role.
Should swimlanes be horizontal or vertical?
Either works. Horizontal lanes are most common in English documentation because the process reads left to right along a timeline. Vertical lanes suit processes with many steps per role or documents printed in portrait. Pick one and stay consistent across a set of diagrams.
How do you build a swimlane diagram?
Fix the start and end points first, name lanes by role rather than by person, keep it to three to seven lanes, use standard shapes, and map what actually happens rather than the official policy. Then count the cross-lane hand-offs to find which ones can be removed.
When should I use a plain flowchart instead of a swimlane?
Use a plain flowchart when the whole process stays inside one role, or when the branching logic rather than the ownership is what you are working out. A swimlane with only one lane is just a flowchart with extra lines.
Can I make a swimlane diagram in the browser without installing software?
Yes. LazyTools' swimlane diagram maker runs entirely in your browser: add a lane per role, drop in steps, drag them between lanes, connect them to draw the flow, and export to PNG, PDF or JSON with no upload or sign-up.