
explainer
Z-Score to P-Value: How to Read the Normal Distribution
By Uttam Regmi · Published 2026-07-11 · Updated 2026-08-23 · 7 min read · Fact-checked, sources cited
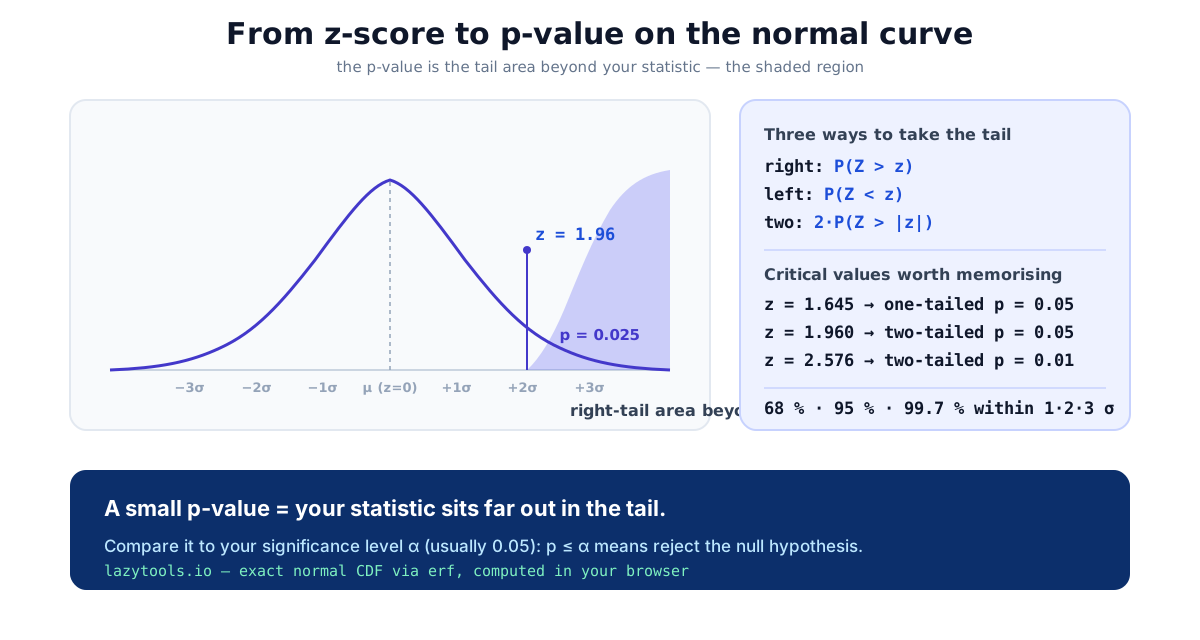
A p-value is simply the area under the normal curve beyond your z-score. Convert a z to a p by taking a tail: right-tailed is P(Z > z), left-tailed is P(Z < z), and two-tailed is 2 × P(Z > |z|). The two numbers everyone remembers: z = 1.96 → two-tailed p = 0.05, and z = 1.645 → one-tailed p = 0.05.
What a z-score and a p-value each mean
A z-score answers “how unusual is this value?” in units of standard deviations:
z = (x − μ) / σ
A z of +1 sits one standard deviation above the mean; a z of −2.5 sits two-and-a-half below. The p-value turns that position into a probability: the chance of landing at least that far out in the tail if nothing but random variation were at work. Position in, probability out, that is the whole conversion, and the normal distribution calculator shows it with the tail shaded so you can see the area you are measuring.
The three tails
The one detail that trips people up is which area to take.
- Right-tailed. You only care about values larger than expected:
p = P(Z > z). - Left-tailed. You only care about values smaller:
p = P(Z < z). - Two-tailed. You care about any difference in either direction:
p = 2 × P(Z > |z|).
Because the normal curve is symmetric, the two-tailed p-value is exactly double the one-tailed value. That is why one significance level, 0.05, maps to two different critical z-scores: 1.645 if you are testing in one direction, 1.96 if you are testing in both.
A quick way to see it: a z of 2.0 puts about 2.28% of the area in the upper tail. If your hypothesis only asks “is it bigger?”, that 2.28% is your whole p-value. If it asks “is it different in either direction?”, you also count the symmetric 2.28% in the lower tail, giving about 4.55%. Same z, same curve, the tail rule you pick doubles or halves the answer.
A z-score to tail-area reference
The table below reads left to right: pick a z, read the one-tailed area beyond it, then double it for the two-tailed p-value. These are the exact tail areas of the standard normal distribution, rounded.
| z-score | One-tailed p, P(Z > z) | Two-tailed p, 2 × P(Z > |z|) |
|---|---|---|
| 1.000 | 0.1587 | 0.3173 |
| 1.282 | 0.1000 | 0.2000 |
| 1.645 | 0.0500 | 0.1000 |
| 1.960 | 0.0250 | 0.0500 |
| 2.000 | 0.0228 | 0.0455 |
| 2.326 | 0.0100 | 0.0200 |
| 2.576 | 0.0050 | 0.0100 |
| 3.000 | 0.00135 | 0.0027 |
Notice the two rows that anchor most textbooks: z = 1.645 gives a one-tailed p of 0.05, and z = 1.96 gives a two-tailed p of 0.05. They are the same significance level applied to different tail rules.
The values worth memorising
| Confidence | α | Two-tailed z | One-tailed z |
|---|---|---|---|
| 90% | 0.10 | 1.645 | 1.282 |
| 95% | 0.05 | 1.960 | 1.645 |
| 99% | 0.01 | 2.576 | 2.326 |
Read it either way: a z of 1.96 gives a two-tailed p of 0.05, and a 95% confidence interval uses that same 1.96. The confidence interval calculator uses these identical critical values to build an interval around an estimate.
A worked example, start to finish
Suppose a standardised test has a known population mean of μ = 100 and standard deviation σ = 15. You give it to a class of n = 25 students and their average score is 106. Is that class meaningfully above average, or just normal sampling wobble?
- Find the standard error of the mean. The sample mean varies less than a single score: SE = σ / √n = 15 / √25 = 15 / 5 = 3.
- Compute the z-score of the sample mean. z = (x̄ − μ) / SE = (106 − 100) / 3 = 2.0.
- Convert to a p-value. A z of 2.0 leaves about 0.0228 in the upper tail. If you had a directional hypothesis (“this class scores higher”), the one-tailed p is ≈ 0.023. If you were simply testing for any difference, the two-tailed p is 2 × 0.0228 = ≈ 0.046.
- Decide. Against the conventional α = 0.05, both p-values fall below the threshold, so you would reject the null hypothesis of “no difference”, the gap is larger than chance comfortably explains.
The only judgement call is step 3’s tail choice, and you should make it before seeing the data. Had the average been 104 instead, z would be (104 − 100) / 3 ≈ 1.33, a two-tailed p of about 0.18, not significant. Small shifts in the statistic move you across the threshold, which is exactly why the exact area matters more than a rounded lookup.
Why a table is not enough
The normal cumulative distribution function, the “area so far” under the curve, has no elementary closed form. Every exact tool computes it through the error function (erf), a high-accuracy series that pins the area to about seven decimal places. A printed z-table, by contrast, is rounded to two decimals of z and forces you to interpolate between cells; and a chatbot asked for P(Z > 2.13) will often quote a plausible-but-wrong figure. Computing it directly avoids both problems, enter any z into the p-value calculator and it returns the exact tail area (and it also handles t, χ² and F statistics, not just z).
Turning the p-value into a decision
A p-value on its own is just an area. It becomes a decision when you compare it to your significance level α, the threshold you set before looking at the data, conventionally 0.05.
- p ≤ α → the result is statistically significant; you reject the null hypothesis.
- p > α → not significant; you fail to reject it.
A small p-value means your statistic sits far out in the tail, the kind of value that would rarely occur by chance alone. It does not measure the size or importance of an effect, only how surprising the data would be if the null hypothesis were true.
Common misreadings to avoid
The z-to-p conversion is arithmetic, but the interpretation is where people slip. A few worth keeping straight:
- A p-value is not the probability the null hypothesis is true. It is the probability of data at least this extreme assuming the null is true, a subtle but important reversal. A p of 0.03 does not mean “3% chance there is no effect.”
- “Not significant” is not “no effect.” A p above α means the data did not clear your evidence bar, often because the sample was small, not because the true effect is zero.
- A tiny p-value does not mean a big effect. With a large enough sample, a trivial difference can produce a large z and a minuscule p. Report an effect size or confidence interval alongside it.
- The z-to-p link assumes a valid z. The conversion only makes sense if the sampling distribution is approximately normal, reasonable for large samples or known-variance means, less so for small samples where a t-distribution fits better.
Quick summary
To convert a z-score to a p-value, take the area under the normal curve beyond it: right-tailed
P(Z > z), left-tailed P(Z < z), or two-tailed 2 × P(Z > |z|). Remember z = 1.96 → p = 0.05
(two-tailed) and z = 1.645 → p = 0.05 (one-tailed), compare the p-value to your α, and use a tool that
computes the exact area via erf rather than a rounded table. Try it on the
normal distribution calculator or the
p-value calculator.
Sources: the standard normal distribution and its cumulative distribution function (the error function, erf); conventional significance testing as taught in introductory statistics. Educational information, not statistical consulting.
Frequently asked questions
How do I convert a z-score to a p-value?
The p-value is the area under the standard normal curve beyond your z-score. For a right-tailed test it is P(Z > z); for a left-tailed test P(Z < z); for a two-tailed test 2 × P(Z > |z|). For z = 1.96 the two-tailed p-value is 0.05. A calculator that uses the exact normal CDF (via the error function) gives the precise area for any z.
What z-score gives a p-value of 0.05?
It depends on the tails. For a two-tailed test, z = ±1.96 gives p = 0.05. For a one-tailed test, z = 1.645 gives p = 0.05. That is why the same 0.05 significance level corresponds to two different critical z-values.
What is the difference between a one-tailed and two-tailed p-value?
A one-tailed test looks for an effect in a single direction (only greater, or only smaller) and takes the area in one tail. A two-tailed test looks for any difference and takes both tails, so its p-value is double the one-tailed value for a symmetric distribution like the normal.
Is a z-score the same as a p-value?
No. A z-score is how many standard deviations a value is from the mean; a p-value is the probability of a result at least that extreme. You convert one to the other through the normal distribution, the z-score is the position, the p-value is the tail area beyond it.
Why not just use a z-table?
A printed z-table is rounded to two decimals of z and requires interpolation, so it loses precision. Computing the p-value directly from the normal CDF gives an exact value for any z-score, for example P(Z > 2.13) to many decimals rather than the nearest table cell.
When is a p-value statistically significant?
When it is at or below your chosen significance level α, most commonly 0.05. A p-value of 0.03 is significant at α = 0.05 (you reject the null hypothesis); a p-value of 0.08 is not. The threshold should be chosen before you see the data.